Python Playground Chapter 2: Spirographs!
In October 2022, I started reading Python Playground and wrote an article to mark the day I started.
As of today, I finished reading and coding for the second chapter of Python Playground. The chapter talked about drawing spirographs using its parametric equations (listed below) and the Python Turtle module. At the end of the chapter were three questions which I also wrote code for. In this post I’ll be first talking about the basics of parametric equations, a brief summary of how the spirograph was drawn and more about the three questions at the end of the chapter.
Spirographs
A spirograph is a drawing device that produces a set of looping curves (see above). The device consists of one large serrated circle and a smaller serrated circle which runs along the edge of the larger circle. Rotating the smaller circle along the larger one in a circular motion will cause any point in the smaller circle to follow the spirograph pattern.

Parametric Equations are equations that return coordinates of a point on a curve using functions of a variable (called a parameter). For example, the parametric equation of a circle is given by:
$x = rcos(\Theta )$
$y = rcos(\Theta )$
For a spirograph, the parametric equations are given by:
$x = R\left ( \left ( 1-k \right )cos(\Theta ) + lk cos(\frac{1-k}{k}\Theta ) \right )$
$y = R\left ( \left ( 1-k \right )sin(\Theta ) + lk sin(\frac{1-k}{k}\Theta ) \right )$
These two coordinates are passed into Python variables and the Turtle is set to this position. To know when to stop drawing the curves, you find the ratio between the radii of the smaller and larger circle. If the ratio is (say) 1:2, it means that the curves will start repeating after 1 revolution and the smaller circle will revolve 2 times. So after one revolution, the program can stop.
The code for the spirograph can be found in the Python Playground repository here.
The first question involves setting the heading of the Turtle. This is done by finding the direction vector between two points in the spirograph and then setting the Turtle’s heading accordingly.
def draw(self):
        # draw rest of points
        R, k, l = self.R, self.k, self.l
        for i in range(0, 360*self.nRot + 1, self.step):
            a = math.radians(i)

            if i == 0:
                xp = 0
                yp = 0
            else:
                ap = a - math.radians(1)
                xp = R*((1-k)*math.cos(ap) + l*k*math.cos((1-k)*ap/k))
                yp = R*((1-k)*math.sin(ap) - l*k*math.sin((1-k)*ap/k))

            x = R*((1-k)*math.cos(a) + l*k*math.cos((1-k)*a/k))
            y = R*((1-k)*math.sin(a) - l*k*math.sin((1-k)*a/k))

            tangent = abs((y - yp) / (x - xp))
            heading = math.degrees(math.atan(tangent))

            self.t.setpos(self.xc + x, self.yc + y)
            self.t.seth(heading)
        # done - hide turtle
        self.t.hideturtle()
xp and yp are the previous coordinates of the Turtle in the spirograph. They are calculated using ap which is the value of the paramter in the previous iteration of the loop. The heading is calculated by finding the inverse tangent of the direction vector.
Spirals
The second question of the chapter involved creating logarithmic spirals using its parametric equations. The equations for a spiral are:
$x = a e^{bt}cos\Theta$
$y = a e^{bt}cos\Theta$
a and b are both arbitrary constants. a describes how large the spiral will be while b describes the frequency of loops the spiral makes.
class Spiral:

    def __init__(self, xc, yc, T, a, b):
        self.t = turtle.Turtle()

        self.t.shape('turtle')

        self.drawingComplete = False

        self.step = 5

        self.setparams(xc, yc, T, a, b)

        self.restart()

    def setparams(self, xc, yc, T, a, b):

        self.xc = xc
        self.yc = yc
        self.a = a # radius
        self.b = b # frequency
        self.T = int(T)

        self.s = 0.0

    def restart(self):

        self.drawingComplete = False
        self.t.showturtle()
        self.t.up()

        T, a, b = self.T, self.a, self.b
        s = 0.0
        x = a * math.pow(math.e, b * s) * math.cos(s)
        y = a * math.pow(math.e, b * s) * math.sin(s)

        self.t.setpos(self.xc + x, self.yc + y)
        self.t.down()
        self.t.clear()

    def draw(self):
        T, a, b = self.T, self.a, self.b

        for i in range(0, 360*T, self.step):
            s = math.radians(i)

            x = a * math.cos(s) * math.e ** (b * s)
            y = a * math.sin(s) * math.e ** (b * s)

            self.t.setpos(self.xc + x, self.yc + y)

        self.t.hideturtle()

    def update(self):
        if self.drawingComplete:
            return

        self.s += self.step

        T, a, b = self.T, self.a, self.b

        s = math.radians(self.s)
        x = a * math.pow(math.e, b * s) * math.cos(s)
        y = a * math.pow(math.e, b * s) * math.sin(s)

        self.t.setpos(self.xc + x, self.yc + y)
        if self.a >= 360*T:
            self.drawingComplete = True

            self.t.hideturtle()

    def clear(self):
        self.t.clear()
The above code describes a class Spiral which takes in the paramters xc, yc, T, a and b. xc and yc are the coordinates of the center of the spiral and T is the number of loops the spiral should make.
setparams() initializes the variables xc, yc, T, a and b. The variable “s” is the angle $\Theta$ used in the paramteric equations and is set to 0. restart() sets the Turtle to the correct position.
The draw() function uses a loop with T as its limit to draw the spiral. Each iteration of the loop sets the turtle to the new position.
The update() function is used to change the coordinates of a single turtle to the next position. The function is used when multiple Turtles are active.
The result of running python spiral.py --sparams 5 30 0.05 in the terminal:

Koch Snowflake
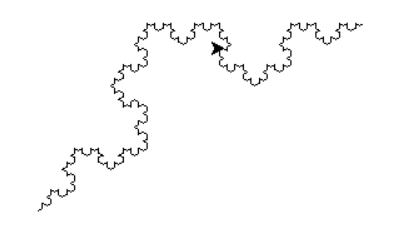
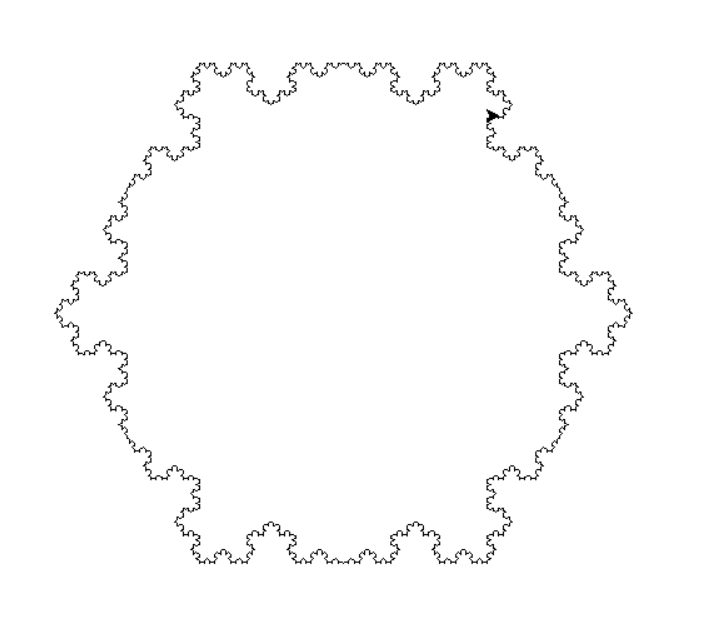
The Koch Snowflake is a fractal curve constructed using recursion. The snowflake is drawn one side at a time where the middle of the side has a triangle jutting out of it. However, what makes it a fractal is the middle of each triangle side also has a triangle jutting out of it and each smaller triangle has more triangles and so on.

def drawLine(A, B):
    x1, y1 = A
    x2, y2 = B
    t.up()
    t.setpos(x1, y1)
    t.down()
    t.goto(x2, y2)

def drawSnowflake(A, B):
    x1, y1 = A
    x2, y2 = B
    m = (math.sqrt((math.pow((x2-x1), 2))+math.pow((y2-y1), 2)))
    if m <= 4:
        drawLine(A, B)
    else:
        p1 = ((x2+(2*x1))/3), ((y2+(2*y1))/3)
        p2 = ((x1+(2*x2))/3), ((y1+(2*y2))/3)
        l = m/3
        ef = ((math.sqrt(3)/2)*((y1-y2)/m)*l, ((math.sqrt(3)/2)*((x2-x1)/m)*l))
        tip = (((x1 + x2) / 2) + ef[0]), (((y1 + y2) / 2) + ef[1])

        drawSnowflake(A, p1)
        drawSnowflake(p1, tip)
        drawSnowflake(p2, B)
        drawSnowflake(tip, p2)
The function drawSnowFlake(A, B) draws a side of the snowflake between two points A and B. If the distance between A and B is too small (here less than 4 units), the function stops by drawing a line between A and B. Otherwise, the function calculates the three points of the middle triangle (p1, p2 and tip) and calls itself four times. The function keeps calling itself until the distance between the passed arguments is too small. Once the limit is reached, the complete snowflake side is drawn. This side can be drawn 6 times to complete the snowflake using the different corners of the snowflake as paramters to pass into the function drawSnowFlake(A, B).
Result:

What is the image I clicked on to open this article?

The image is from an infamous panel in Junji Ito’s Uzumaki - one of the strangest horror manga I’ve read. The story involves a small town which gets haunted by the concept of a spiral resulting in increasingly bizarre phenomenon. I highly recommend reading it if you’re a fan of horror.
That’s all I have for now. Live Long and Prosper!
Links
Here is a really good demonstration of a logrithmic spiral: Spiral